Image Recognition Machine Learning/k-NN/Cross Validation
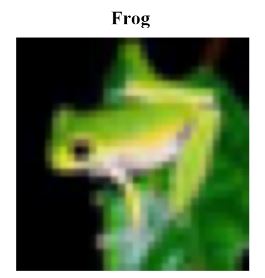
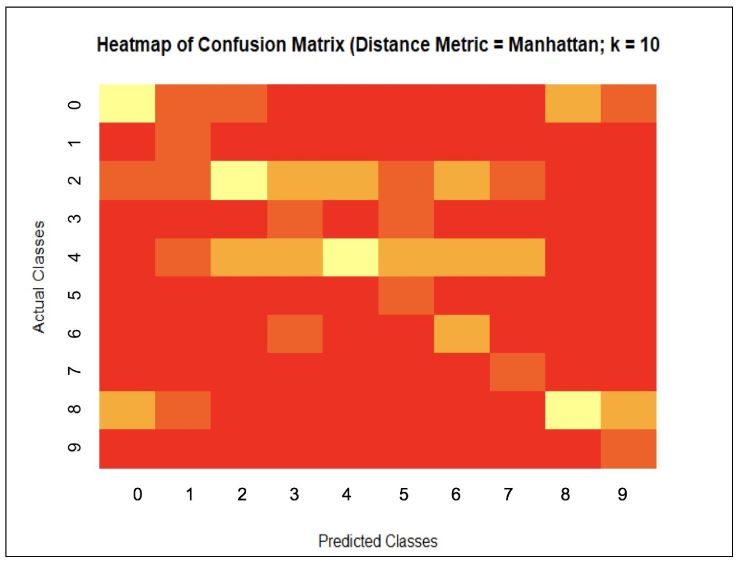
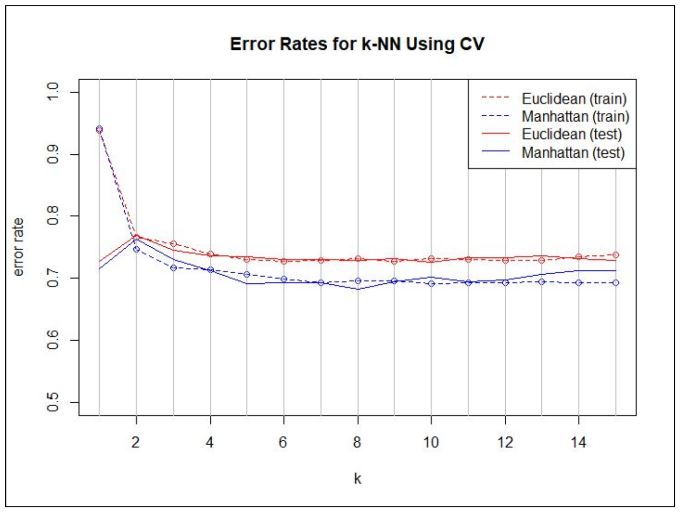
An image recognition group project was completed as part of the Statistical Data Science (STA 141A) course at the University of California, Davis, with Prof. Gupta. The goal was to create an Image Recognition program in R that could analyze 32×32 pixel images and predict their category. To predict an image’s category, each image was seen in an RGB color matrix, and the distance function was used to create a distance matrix between all of the pixels in a given image with every other image. To determine which class a particular image may belong to, k-Nearest Neighbors, or k-NN, was used to ‘vote’ for which class an image may belong to based on which images are most similar. Another step was to use Cross-Validation to train a training set. The Cross-Validation used 10-folds, where the training set was divided into 10 groups, and k-NN was performed on each of the folds to determine the accuracy for the different parameters of \(k = 1,\cdots,5\), and the distance metric of either Euclidean or Manhattan distances. In the end, the optimal parameters were then used on the test set to determine the best accuracy possible that may be achieved.