USA Spending Data Analytics for Business Owners
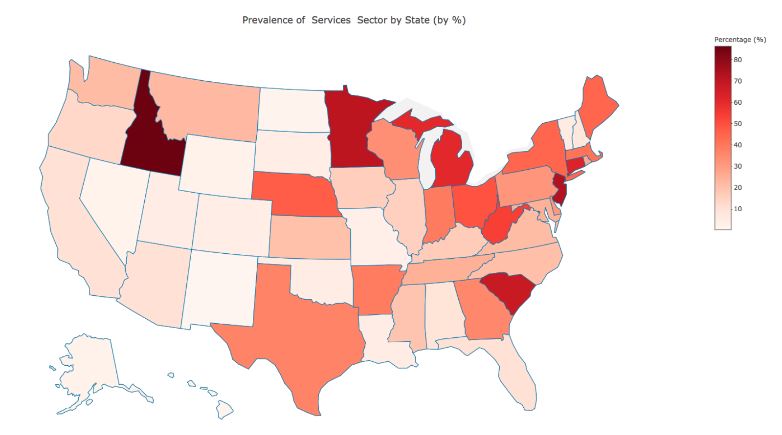
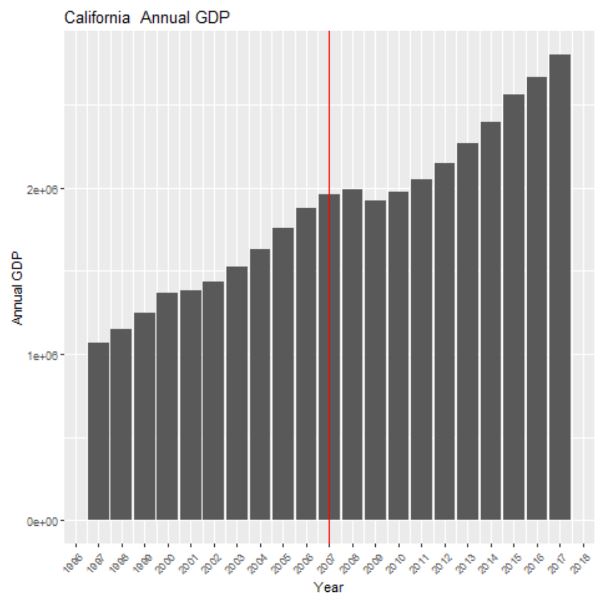
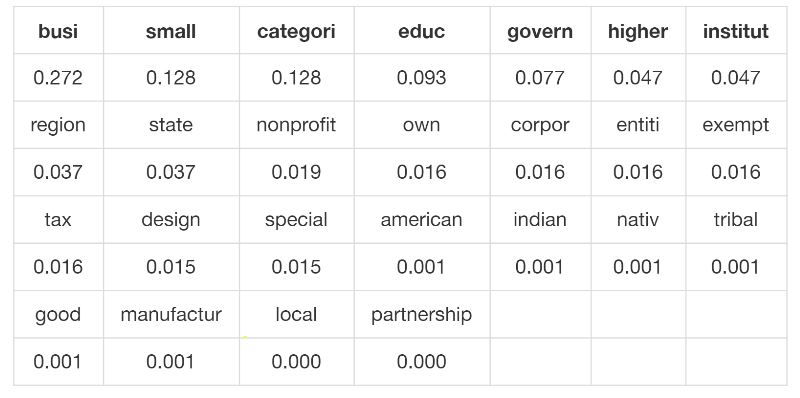
This was a group final project for Adv. Stat Computing (STA 141C) at the University of California, Davis that was taught by a graduate student, Clark Fitzgerald. Our project analyzed the big data from usaspending.gov and created a platform from which potential business owners could understand their potential for finding contractual work with the federal government. Time series analysis was used to model future government spending for all 50 states. An ARIMA model was fit to each state where the AICc criterion was used to determine the optimal fit. Geo plotting was done with the Plotly package to create geographic heatmaps of the major business sectors using the NAICS code from the dataset. Various macroeconomic variables were plotted using ggplot2 and an API from the St. Louis Federal Reserve. Also, text mining was done on two different descriptive variables, where a weighted character vector was created using Natural Language Processing (NLP) techniques to determine a description of the business categories and awarding agencies for each state. Lastly, different machine learning algorithms were modeled to try and predict possible future spending for each state. This information was compiled in a report in a Google document where there was an abstract, introduction, methods section, results, conclusion, and a discussion section.