Nutrition Analysis
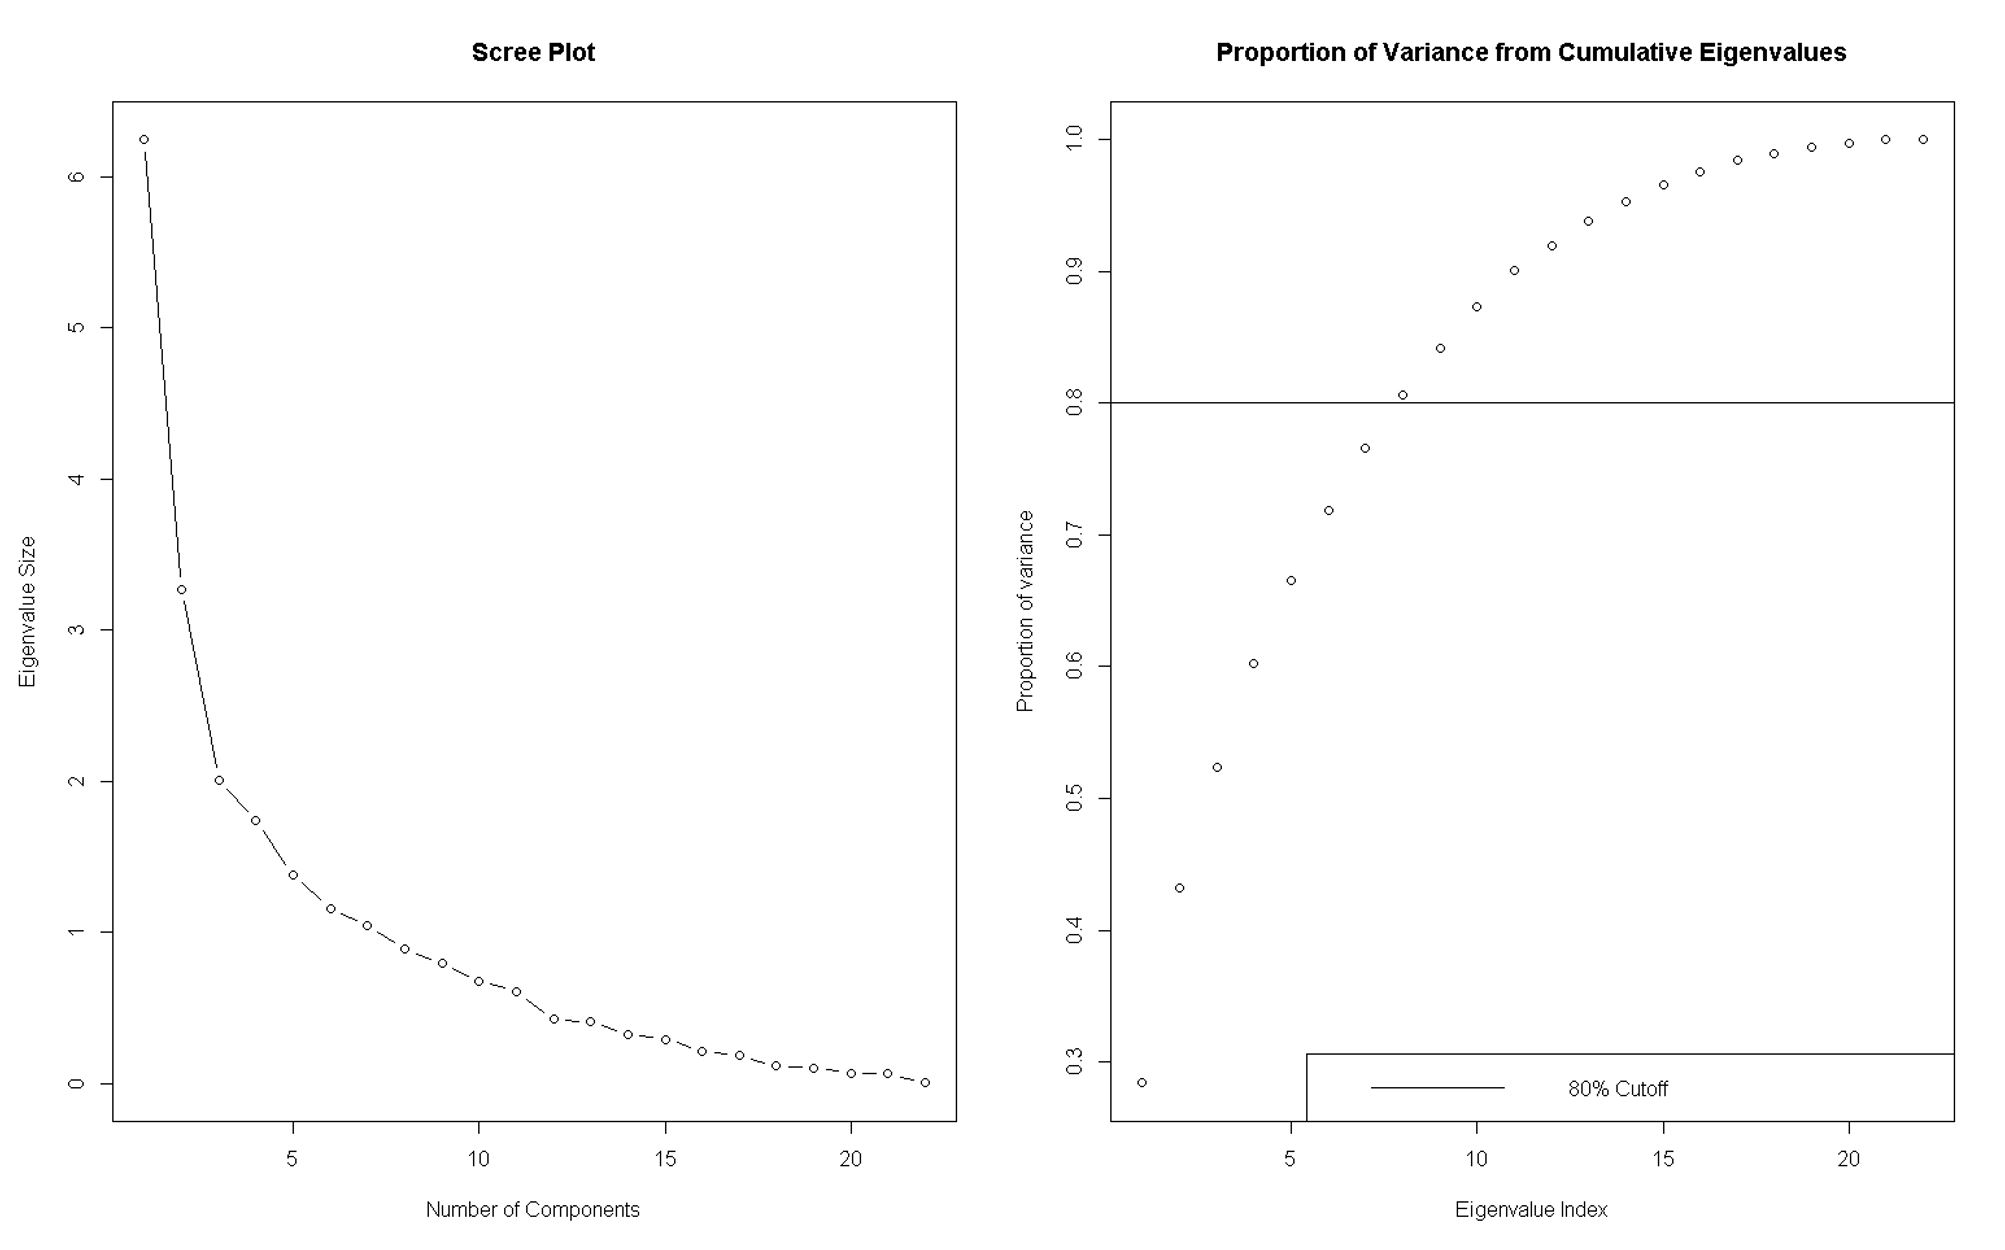
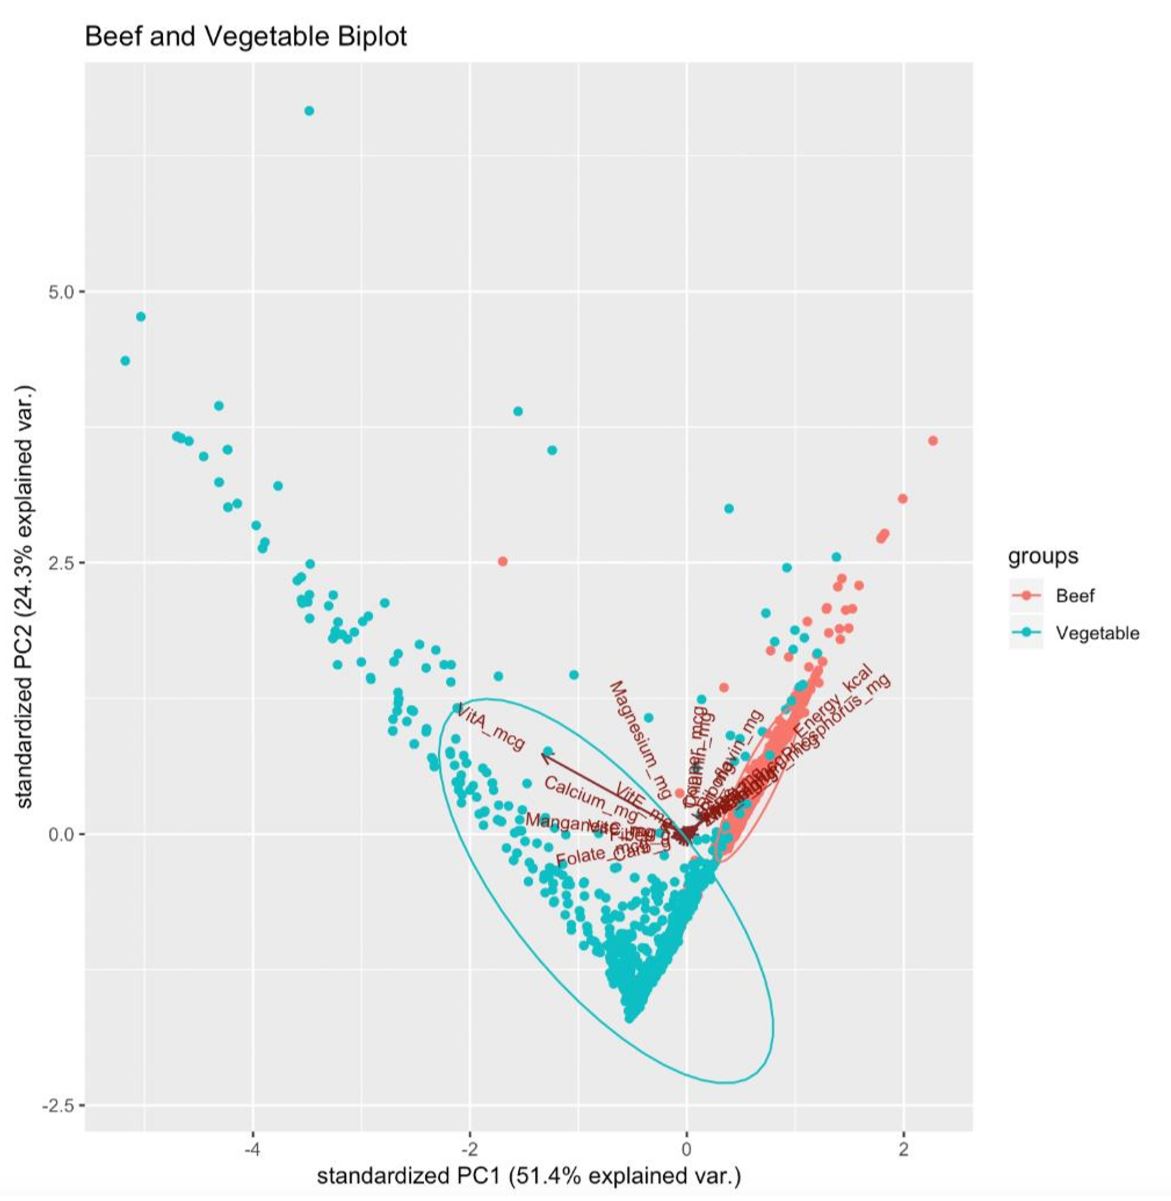
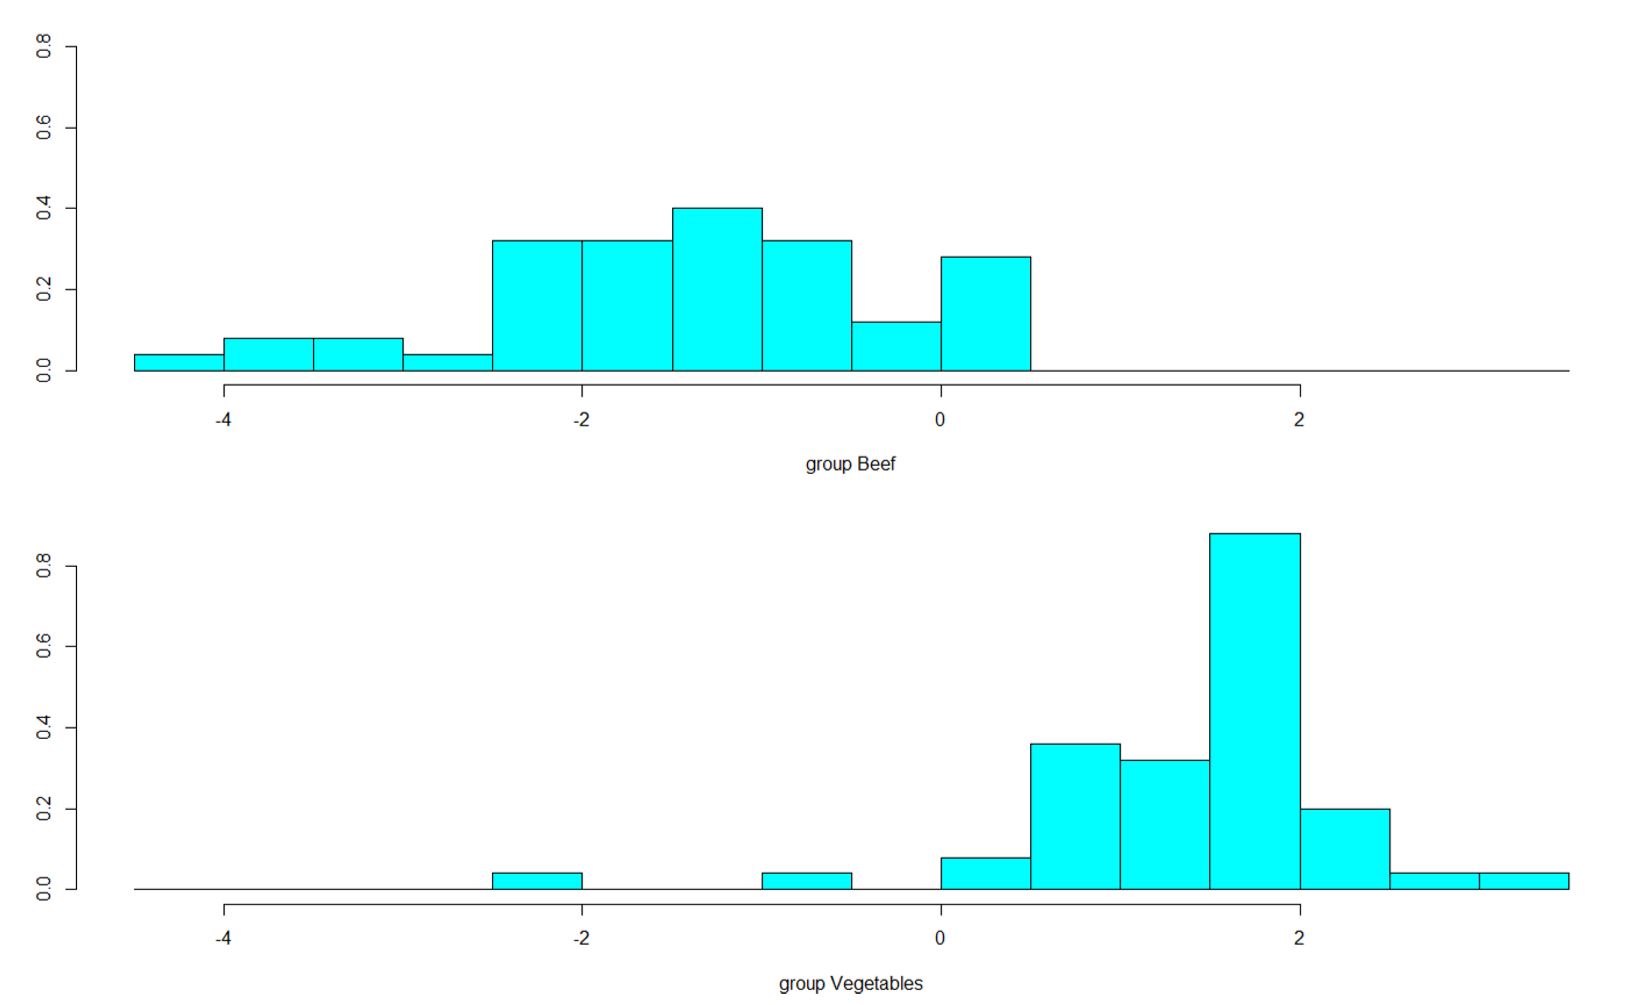
This was an individual project for the Multivariate Data Analysis (STA 135) class from the University of California, Davis with Prof. Li. The programming analysis was done using R. In the project, a nutritional dataset selected from online with thousands of observations divided into various food groups was utilized. Each observation consisted of columns that described the various nutrient contents for 100 grams of a given food (e.g., Australian Wagyu Steak, grilled beef patty, etc.). Then performed multivariate analysis comparing the food groups beef and vegetable products. The different methods included simultaneous confident intervals using Hotelling’s T-squared and Bonferroni’s corrected method, Hotelling’s two-sample test, principal component analysis (PCA), and linear discriminant analysis (PCA). The analysis was compiled into a report that summarized the data, described the process of analysis, along with interpretations and conclusions of the results. Final grade, 100%.


