Time Series Analysis of Annual Temperature Anomalies
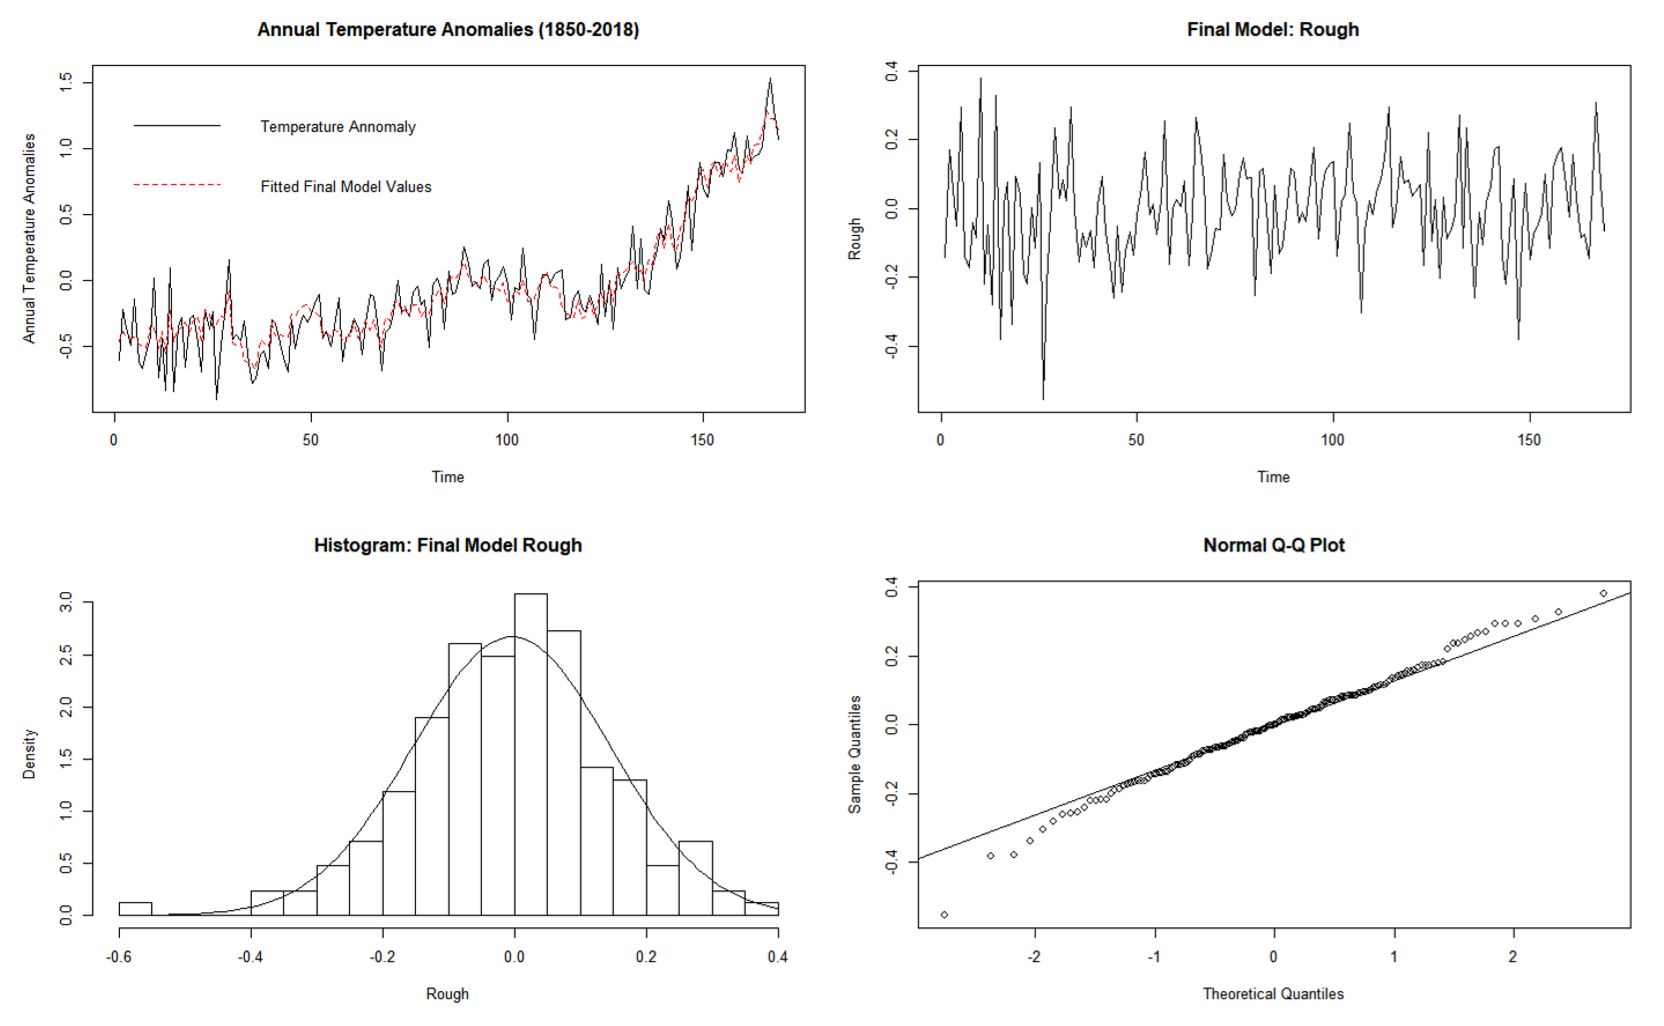
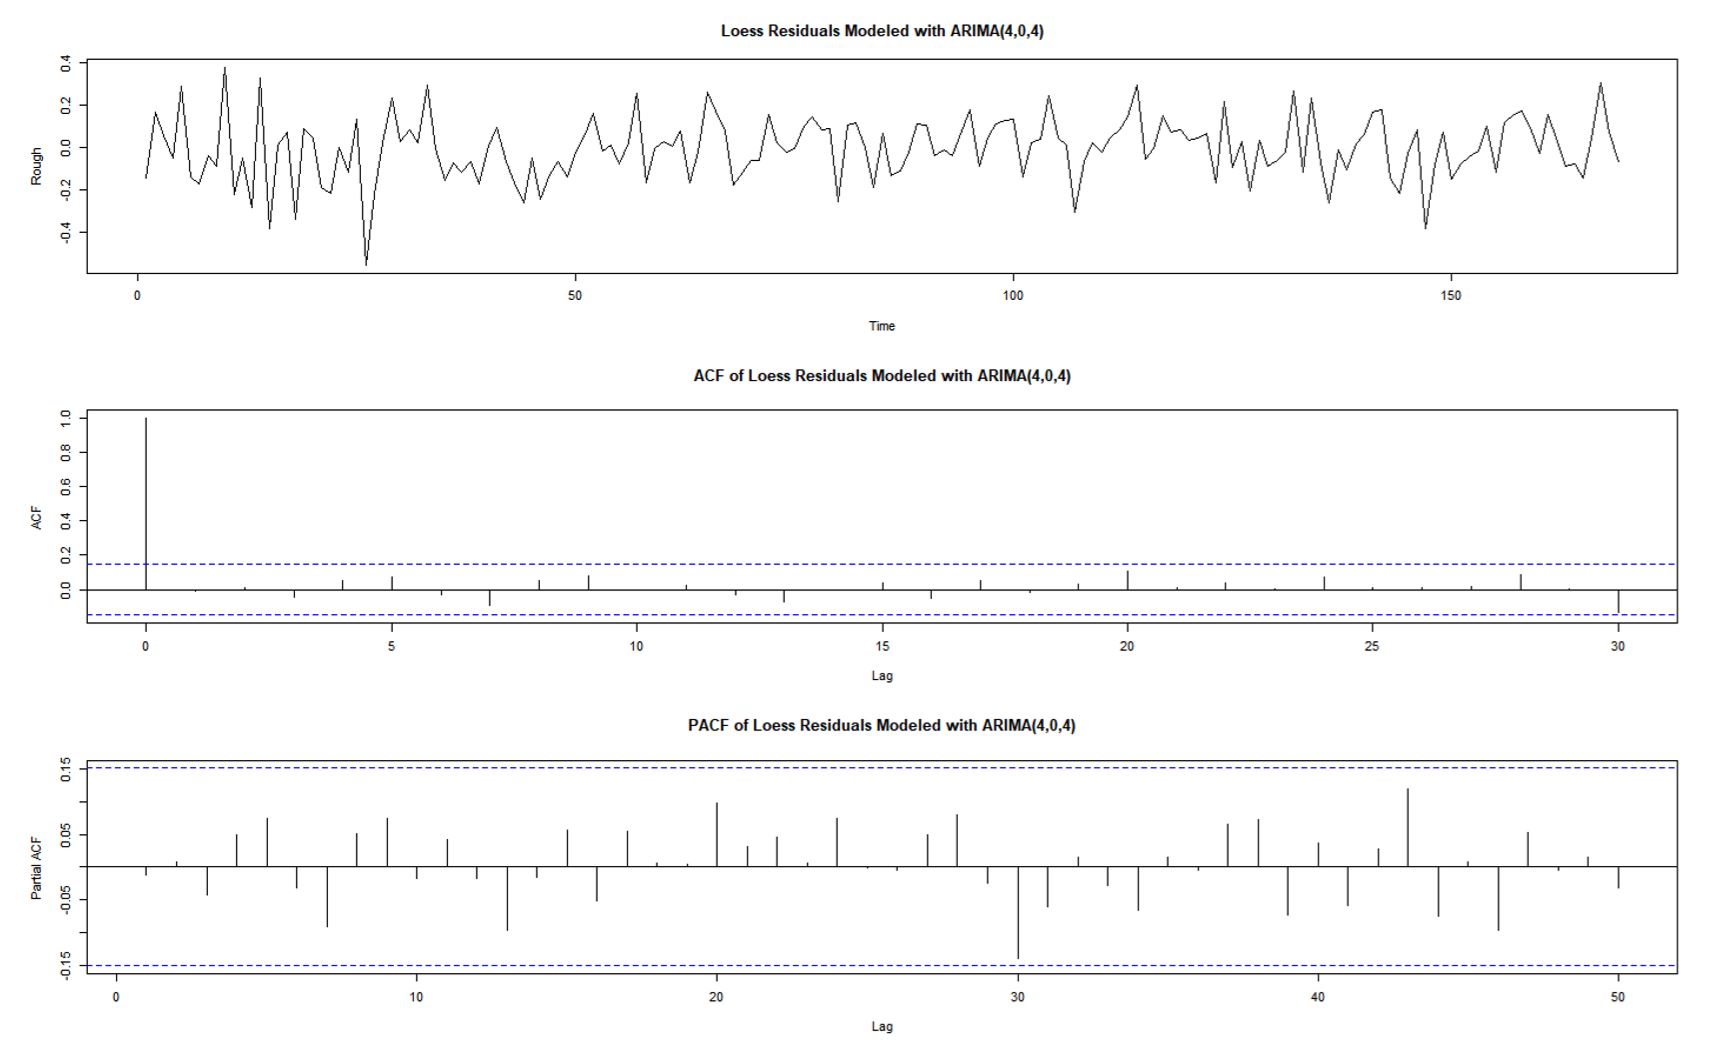
This was a final group project for Applied Time Series Analysis (STA 137) from the University of California, Davis course taught by Prof. Burman. In the project, students were given time series data related to fluctuating annual temperatures. Together with a classmate, a report was written where all the methods and materials utilized were briefly introduced and explained. The results of the analysis using RStudio were then shared using various graphs and tables. Three possible ARIMA models were developed and reasons were given for why they were chosen. Reasons for model selection included: ACF, PACF, normality assumptions, p-values of coefficients, and periodograms through spectral analysis. Eventually, the final model was used to forecast future temperatures using linear extrapolation. The conclusion summarized the results of the analysis along with further interpretation about other possibilities that could have been approached given more time. Final grade, 100%.