Linear Regression
Introduction
During middle school we can all recall first learning about the equation of a line in algebra. It follows the format of \(y = mx + b\). The formula allows us to draw a straight line through 2-dimensional space. This formula is useful in regression when doing data analysis. The exact formula of course will not be used, but something that looks incredibly similar.
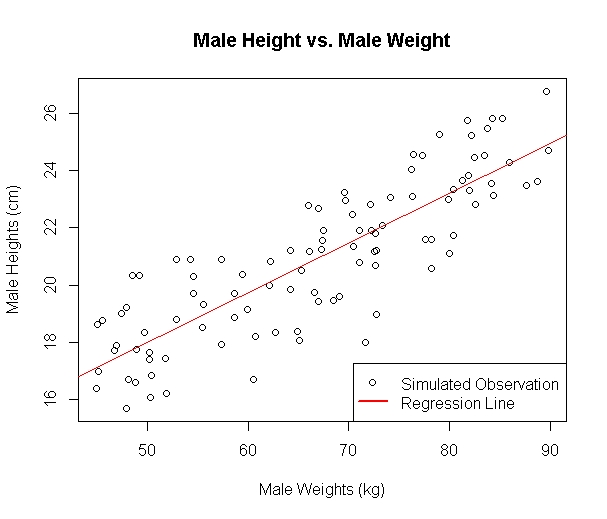
Take for example some simulated data of heights and weights for Chinese men and women aged 20-24. Based on government statistics, 50 observations for men and women each were simulated with their means based on sample the data. The standard deviation of the randomly generated data is arbitrarily chosen as 3 (the actual value was not given). Here is the code on lines 1-13 that shows the process of simulating the observations:
Below, the sorted data has been plotted with the height on the y-axis and the weight on the x-axis. The code which does this is on lines 15-23.
- The Benefit of Matrix Representation
- The Style of Notation Used on this Website
- Extensions from Univariate to Multivariate
- Applications of the Matrix Format
The Benefit of Matrix Representation
References:
[1] Applied Multivariate Statistical Analysis 6th Ed., Johnson, Wichern
[2] https://en.wikipedia.org/wiki/Matrix_(mathematics)
[3] https://stattrek.com/matrix-algebra/matrix-notation.aspx
[4] https://en.wikipedia.org/wiki/Mahalanobis_distance
[5] https://en.wikipedia.org/wiki/Multivariate_normal_distribution